AUC and ROC Curve
AUC (Area Under Curve) and ROC (Receiver Operating Characteristic) Curve are important evaluation techniques used for classification models in Machine Learning. They help measure how well a model can distinguish between different classes at various threshold values.
ROC Curve visualizes model performance, while AUC provides a single numerical score representing the model’s classification ability.
Why ROC Curve and AUC are Important
ROC and AUC help:
- Evaluate classification models
- Compare classifiers
- Analyze threshold performance
- Measure class separation ability
- Handle imbalanced datasets
ROC and AUC are mainly used for binary classification problems.
Understanding Classification Threshold
Most classification models predict probabilities.
Example:
Spam Probability = 0.85
If threshold:
Threshold = 0.5
Prediction:
Spam
Changing threshold values affects model predictions.
What is ROC Curve?
ROC Curve is a graphical representation showing the relationship between:
- True Positive Rate (TPR)
- False Positive Rate (FPR)
at different threshold values.
ROC Curve Axes
| Axis | Metric |
|---|---|
| X-axis | False Positive Rate (FPR) |
| Y-axis | True Positive Rate (TPR) |
True Positive Rate (TPR)
TPR is also called:
Recall or Sensitivity
Formula
TPR = TP / (TP+FN)
False Positive Rate (FPR)
FPR measures how many negative cases are incorrectly classified as positive.
Formula
FPR = FP / (FP+TN)
Understanding ROC Curve
The ROC Curve shows:
- How Recall changes
- How False Positives change
- Model performance across thresholds
Ideal ROC Curve
A good model:
- High TPR
- Low FPR
This produces a curve close to the top-left corner.
What is AUC?
AUC stands for:
Area Under the ROC Curve
It measures the overall ability of the model to separate positive and negative classes.
AUC Score Range
| AUC Value | Model Performance |
|---|---|
| 1.0 | Perfect model |
| 0.9 | Excellent |
| 0.8 | Good |
| 0.7 | Average |
| 0.5 | Random guessing |
Higher AUC means better classification performance.
Real-Life Example — Disease Detection
Suppose a model predicts whether patients have a disease.
A good model should:
- Detect sick patients correctly
- Avoid wrongly classifying healthy patients
ROC Curve helps visualize this balance.
Python Example — ROC Curve
from sklearn.datasets import load_breast_cancer
from sklearn.linear_model import LogisticRegression
from sklearn.model_selection import train_test_split
from sklearn.metrics import roc_curve, auc

import matplotlib.pyplot as plt

# Dataset
data = load_breast_cancer()

X = data.data
y = data.target

# Split data
X_train, X_test, y_train, y_test = train_test_split(
    X, y, test_size=0.2
)

# Train model
model = LogisticRegression(max_iter=5000)

model.fit(X_train, y_train)

# Prediction probabilities
y_prob = model.predict_proba(X_test)[:, 1]

# ROC values
fpr, tpr, thresholds = roc_curve(y_test, y_prob)

# AUC score
roc_auc = auc(fpr, tpr)

# Plot ROC Curve
plt.plot(fpr, tpr,
         label=f"AUC = {roc_auc:.2f}")

plt.plot([0,1], [0,1], linestyle="--")

plt.xlabel("False Positive Rate")
plt.ylabel("True Positive Rate")

plt.title("ROC Curve")

plt.legend()

plt.show()
Output
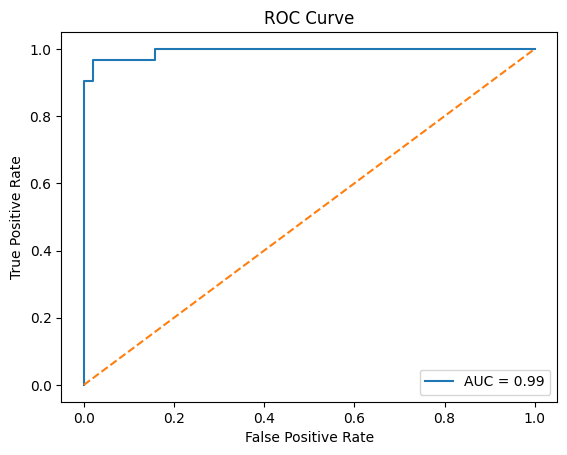
Understanding the ROC Plot
Diagonal Line
Random Guessing
A model near this line performs poorly.
Better Models
Curves closer to the top-left corner indicate better performance.
ROC Curve vs Accuracy
| Accuracy | ROC/AUC |
|---|---|
| Depends on threshold | Evaluates all thresholds |
| May fail on imbalanced data | Better for imbalanced datasets |
Advantages of ROC and AUC
- Threshold-independent evaluation
- Better for imbalanced datasets
- Easy classifier comparison
- Visual performance analysis
Limitations
- Mainly useful for binary classification
- May not fully reflect real-world costs of errors
Real-World Applications
| Application | Usage |
|---|---|
| Fraud Detection | Classifier evaluation |
| Medical Diagnosis | Disease prediction |
| Spam Detection | Threshold analysis |
| Credit Risk Analysis | Risk classification |
Important Points
1. ROC Curve plots TPR against FPR.
2. TPR is also called Recall or Sensitivity.
3. AUC measures classifier performance.
4. Higher AUC indicates better classification ability.
5. ROC and AUC are commonly used for binary classification.
Summary
ROC Curve and AUC are important classification evaluation techniques used to measure how well machine learning models distinguish between classes. ROC visualizes the relationship between True Positive Rate and False Positive Rate, while AUC provides an overall performance score for classification models.
Keywords
ROC Curve, AUC, AUC ROC Curve, ROC Curve in Machine Learning, Area Under Curve, Receiver Operating Characteristic Curve, True Positive Rate, False Positive Rate, Sensitivity, Classification Evaluation Metrics, Binary Classification Evaluation, ROC AUC Score, Model Evaluation, Threshold Analysis, ROC Curve using Python, AUC Score Calculation